Dashboards
Key IT Metrics at a Glance
IT management software produce large quantities of data. It can often to be difficult for IT Managers to capture the metrics they need to make informed decisions.How VIZOR Focuses on Metrics Most Important to You
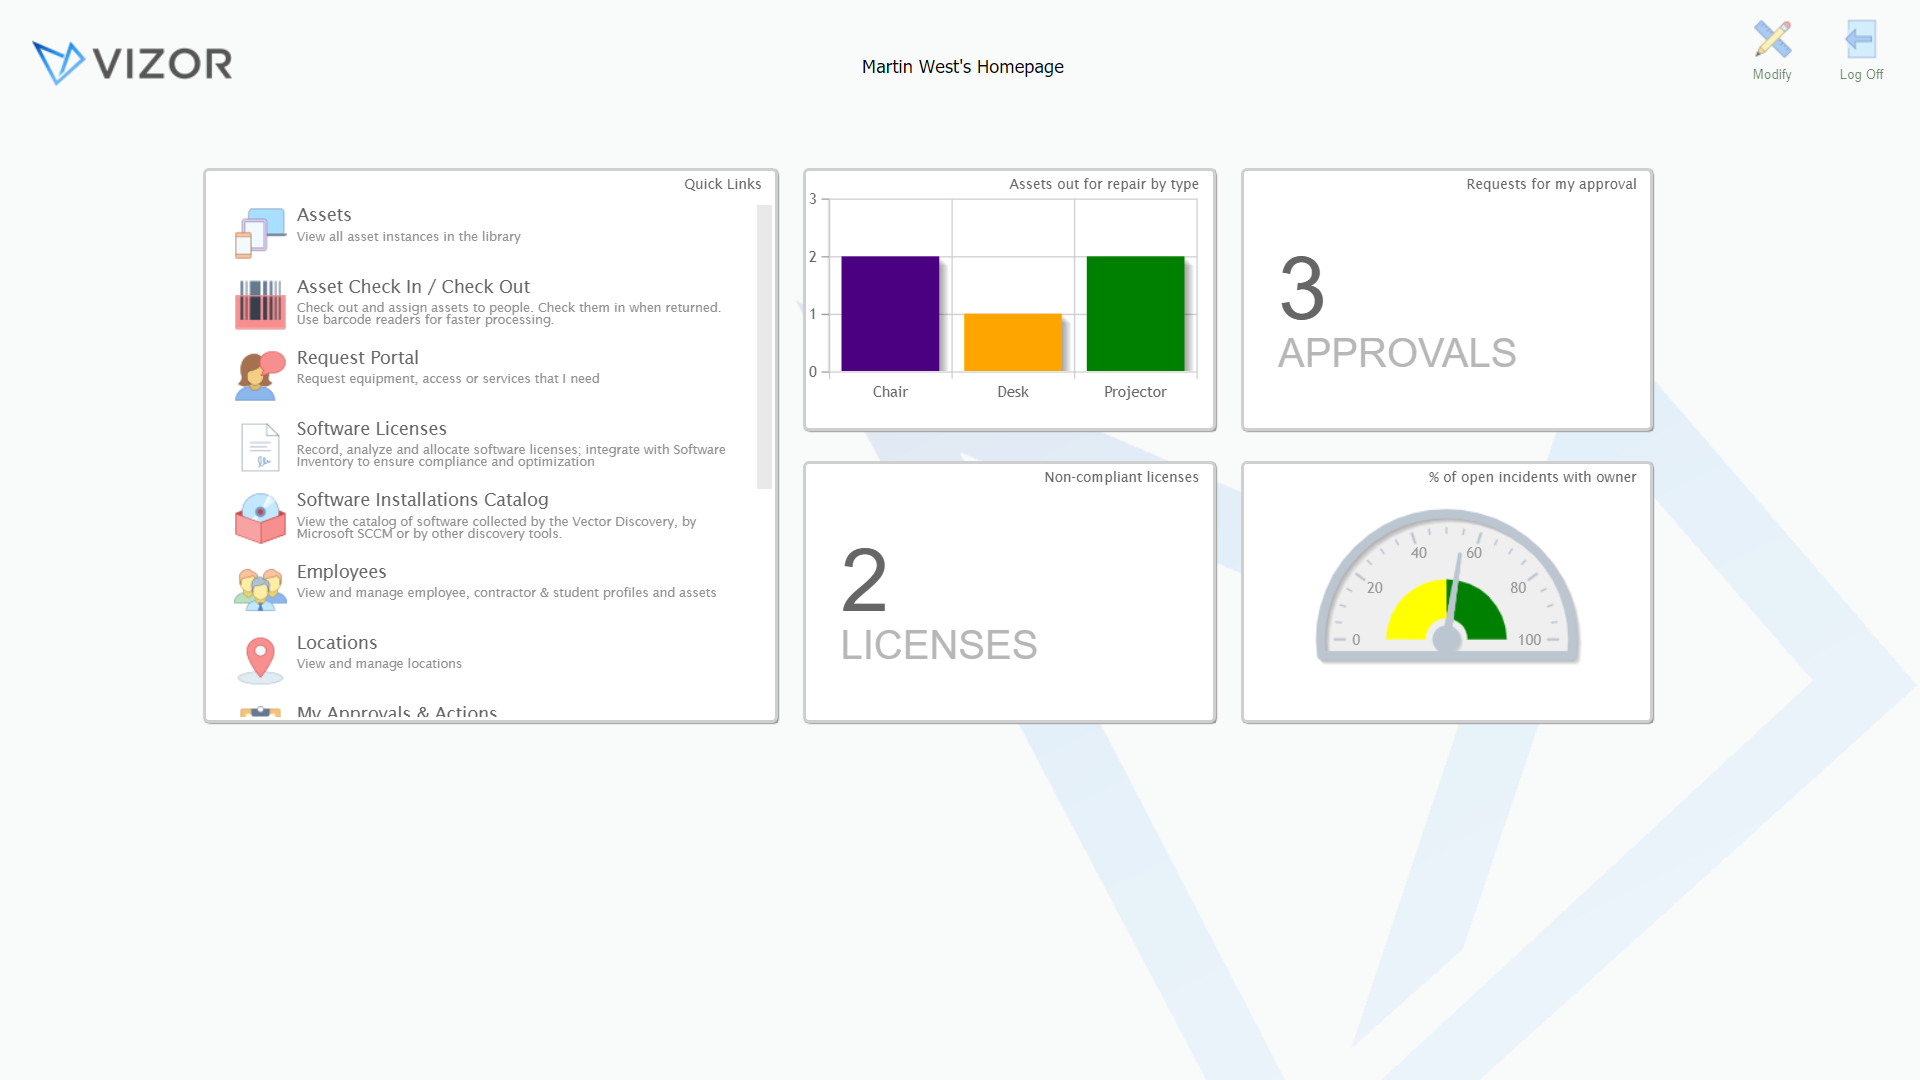
Each member of the IT team can easily customize their personal VIZOR dashboard with key performance indicators that are most relevant to their role. For example, an IT Asset Manager may want to see the number of assets that are out for repair. A Software Asset Manager may want to see the number of upcoming license renewals. A Service Desk Manager may want to see outstanding tickets. The VIZOR dashboard can also be configured for “Wallboard Mode.” As the name suggests, it’s possible to display the team’s key performance indicators on a screen in the office. It provides the important metrics at a glance."VIZOR was selected because it has a clean user interface and powerful integration opportunities for connecting IT to other business units."
Iowa Department of Education

Out-of-the-Box Widgets
Out-of-the-box, VIZOR includes a library of over 40 widgets to customize your dashboard.

User customizable
Each user can easily create their own personal homepage with KPI’s important to their role by selecting widgets from the homepage library.

Drilldown
Many widgets have a drilldown link which provides quick access to detailed data represented in the high-level metric.

Wallboard Mode
VIZOR’s dashboard can be configured in wallboard (TV dashboard) mode for organizations with a mounted office screen. This provides a glanceable view of the team’s key performance indicators.


